A look at statistics for fatalities and casualties on the roads.
The past decade has seen a divergence between the rate of accidents for cycle users versus other types of users. Overall, road fatalities and casualties are falling, but cycle users are seeing a rise in the number of serious casualties
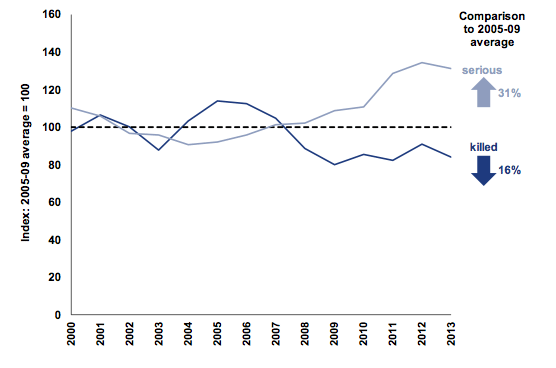
In the past 15 years, there has been a trend for cycling fatalities to fluctuate between 100 and 120. Serious casualties have seen a 31% increase.
Number of killed or seriously injured cyclists 2000-2013
2013 Overall Fatalities
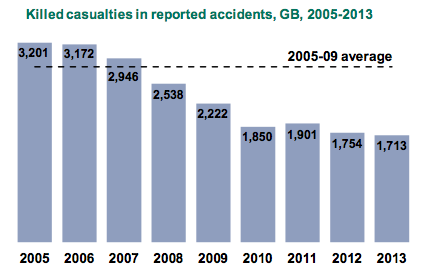
Significant fall in overall fatalities on UK roads.
Fatalities by mode of transport 2013
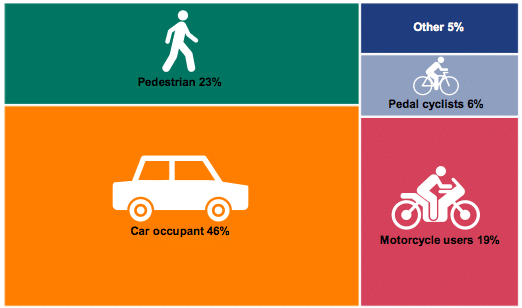
- Cycling fatalities – 109
- Pedestrian fatalities – 398
- Motorcycles – 331
- Car – 785
Cars account for approx 78% of journeys but 46% of fatalities.
Increase in number of accidents
Although cycle fatalities have fluctuated around 100-120, there has been a steady increase in the number of serious casualties in the past 10 years. Whilst car users have seen a significant fall in casualties and fatalities, cycle users have seen an increase.

Source: Gov.uk
- Between 2002 and 2012, the number of fatalities and serious injuries for cyclists has increased from 2,450 to 3,340 – a 36% increase
- By contrast for car occupants fatalities and serious injuries has fallen from 18,728 to 9,033 – roughly a 50% fall
- Pedestrians casualties has fallen in this decade from 8,631 to 5,979.
- Source: Reported killed or seriously injured casualties, by road user type, Great Britain, 2002 – 2012. Table RAS30005
The only positive aspect to these statistics is that the increase in accidents and fatalities can be partly attributed to rising cycle use. But, I believe the increase in casualties is greater than the increase in cycle use. According to the Times casualties are rising five times faster than cycle use (link)
You could attribute falling car fatalities to improved construction of cars, But, this wouldn’t explain why pedestrians have seen a fall in casualties whilst cyclists haven’t.
All Cycle accidents

In context, the relative dangers of cycling vs other modes of transport per km

Note, these statistics reflect casualties per km travelled. If you used casualties per individual journey – it would look quite different and cycling would appear more dangerous.
Cycling Fatalities in context
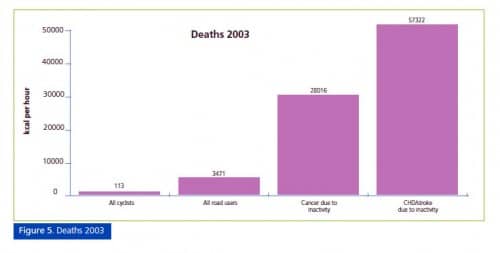
Perceptions about the dangers of cycling deter many from cycling. But, in perspective, mortality rates from cycling are much lower than the ‘silent killers’ , such as heart disease.
UK Deaths in 2003
- All Cyclists – 113
- All road users – 3,471
- Cancer due to inactivity – 28,016
- CHD / Stroke due to inactivity – 57,322
From: Cycling and health
See also: How dangerous is cycling?
International Comparisons
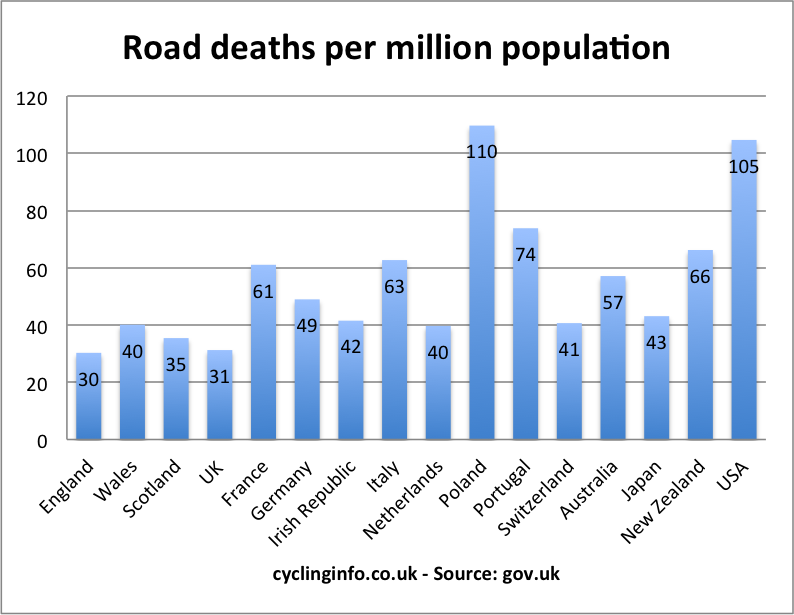
Unfortunately, international comparisons only show overall road fatalities, it would be interesting to see statistics specifically for cycle use. USA one of the highest in the developed world.
Reasons for Fatalities and accidents
- A report by Transport for London found fatal and serious collisions involving cyclists in 2011 showed that 56% were caused by the motorist driving in an ‘unlawful or anti-social’ manner, compared to only 6% caused by cyclists doing the same. (link)
- Failed to look properly? was attributed to the car driver in 57% of serious collisions and to the cyclist in 43% of serious collisions at junctions
- Risky cycling behaviour? A Department for Transport, found that in 2% of cases where cyclists were seriously injured in collisions with other road users police said that the rider disobeying a stop sign or traffic light was a likely contributing factor. Wearing dark clothing at night was seen as a potential cause in about 2.5% of cases, and failure to use lights was mentioned 2% of the time. (Guardian)
- In London 20% of fatal cycling accidents involve a HGV – often when a HGV is turning left at a junction.
- About 25% of serious accidents involve a HGV or bus ‘passing too close to a cyclist’ (ROSPA)
With adult cyclists, police found the driver solely responsible in about 60%-75% of all cases, and riders solely at fault 17%-25% of the time.. But, in the case of children, the police found that it was mostly the young cyclists to blame for failure to take care.
Chris Peck, (CTC cycling organisation) noted: “Government must invest more in cycling infrastructure, implement lower speed limits and increase traffic law enforcement: the number of road traffic police has fallen by 29 per cent in ten years.”
Common cycling accidents
- Motorist emerging into path of cyclist (not seeing the cyclist on the road)
- Motorist turning across path of cyclist
- Cyclist riding into the path of a motor vehicle, often riding off a pavement
- Cyclist and motorist going straight ahead
- Cyclist turning right from a major road and from a minor road
- Child cyclist playing or riding too fast
How to reduce fatalities?
- Effective speed limit reductions in urban and rural environments
- Improved technology for HGVs to help reduce number of blind spots.
- Legislation on safe passing distances.
- More proactive road policing – fining (taking away license) for irresponsible behaviour. Not just waiting for accidents to happen.
- Cycle infrastructure designed to keep cyclists safe.
- Cycle safety awareness part of driving test
- Better cycle safety training for children
- Safety in numbers? The hope is that higher numbers of cyclists contribute to greater overall safety. Though these statistics suggest that increasing numbers is not sufficient to make cycling safer.
Latest data
- Casualties by ONS
How to reduce fatalities and serious accidents is worth a post on its own not just a foot note on these statistics.
ROSPA recently summarised
‘Training is an important strand in the wider safety strategy for cyclists. It must go hand in hand with measures to create a safer cycling environment and measures to improve the behaviour of motorists.’
Real reason is motive of HGV. Would love to see info on this.