November was a bad month for cycle casualties, with several tragic accidents reported in the press.
These are some statistics produced by the Department of Transport for road traffic accidents, which helps give a perspective on the dangers of cycling on British roads. (Source: Sept 2013 D o T)
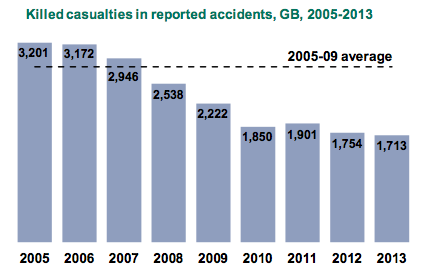
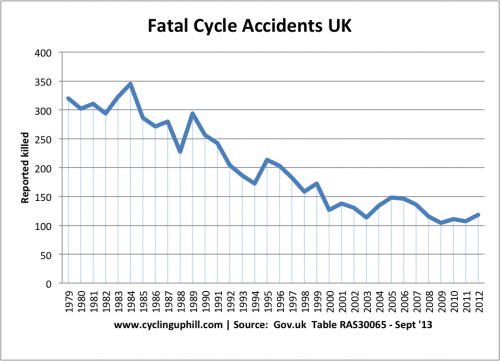
Fatal Accidents
Fatal accidents have been falling in the past few decades. In 2012, 118 cyclists were killed. This was higher than in 2011 when fatalities fell to 107. However, it is significantly lower than early 1980s, when it reached a peak of 350. This compares to:
- 420 pedestrian fatalities
- 328 motorcycle fatalities
- 801 car occupant fatalities.
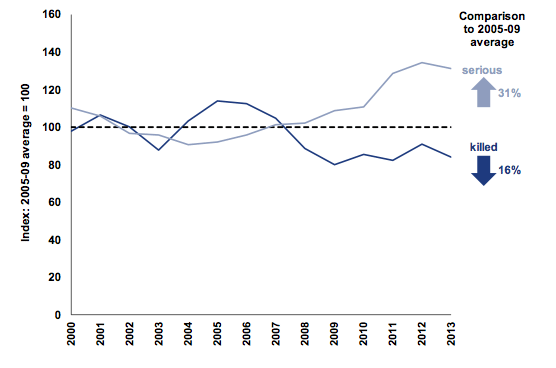
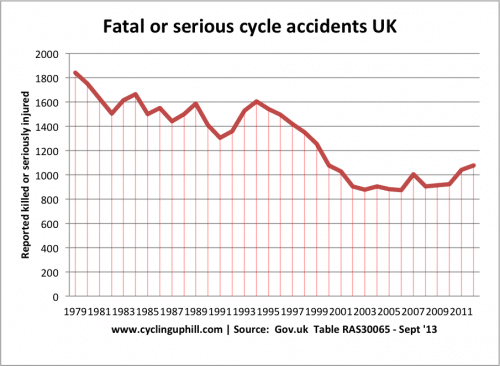
Fatalities and serious accidents
If we include all serious accidents in addition to fatalities, there has been a stronger upward trend since 2003.
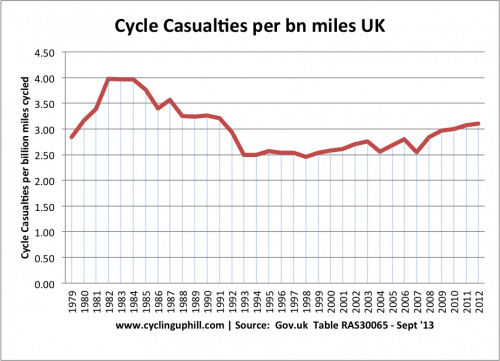
Cycle accidents per miles cycled
If we look at cycle casualties per billion miles cycled, the situation looks less promising. There was a significant improvement in cycle rates in the 1980s. But, the increase in cycle rates since late 1990s appears not to have caused the hoped for ‘safety in numbers’ we might expect. This shows that cycle casualties per bn miles cycled is increasing in the past decade.
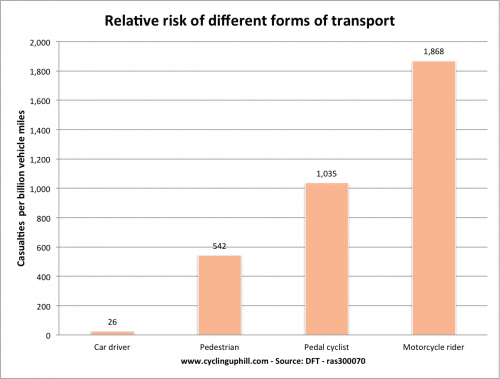
Relative risk of different forms of transport – Cycling vs Car vs Pedestrian vs Motorbike
These statistics show casualties per billion km travelled. They produce a slightly skewed figure in that car drivers will clock up many miles on motorways, which tend to have much lower accident rates per miles travelled, compared to rural and urban areas. Nevertheless, it still shows how much safer car journeys are compared to cycling or walking. Which is to be expected. In a car you are protected by crumple zones and a block of steel. Walking and cycling, you are not.
Casualties compared
Fatalities by mode of transport
Using fatalities, pedestrians have a slightly worse risk than cyclists.
Read more